Google

Thursday, July 27, 2006

Risk assessment with MPD bands


Signals for YMU06 were tested using VWAP and MPD bands to filter out any risky entries.

The first two signals ( one Long, one Short ) were stopped out as these positions were taken near MPD bands.

But the third signal to Short worked the wonder. The signal appear in the neutral area, near VWAP itself.

Risk assessment with MPD bands should be implemented.

Monday, July 24, 2006

Momentum Exhaustion Exit or MEEP

Exit is as important as Entry. We've had a working Entry System but Exit System was a mystery until recently.

We could use SuperTrend to follow the trend but it does not point to the Most Efficient Exit Point (MEEP).

Thanks ot Grey1 ( who is moderating TT thread on T2Win site), I am now applying multi TimeFrame exhaustion as one of the exits method.

Here is the trade


  • Sellshort entry @ 11015. ( Open after one Red Bar print )
  • Exit @10868. ( exit after system generated blue dot signal )

147 points profit. And then another chance to enter a new trade.


Such an awesome signal ................ backtesting was also satisfactory, except for the Longs where the rally often continues.

At least one solution is with me now.

Tuesday, July 18, 2006

VWAP strategy

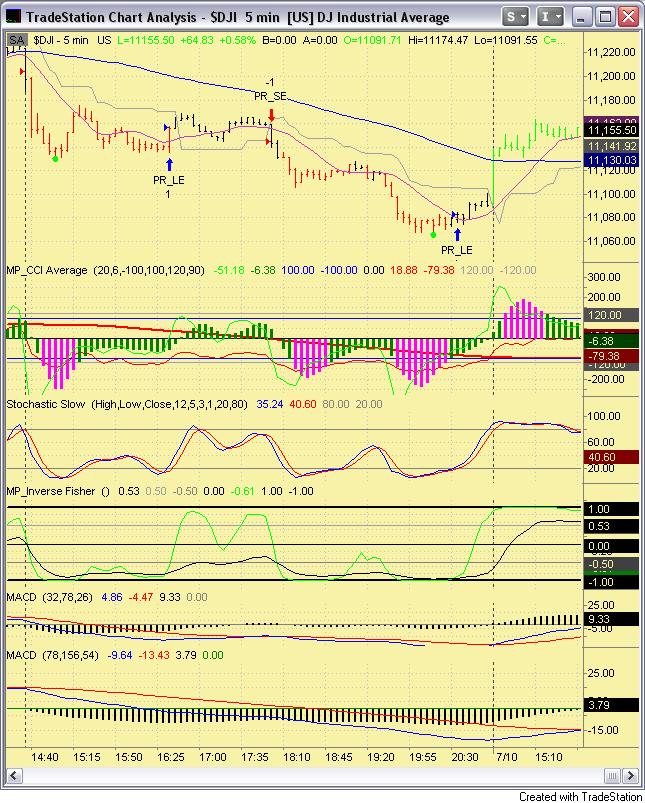
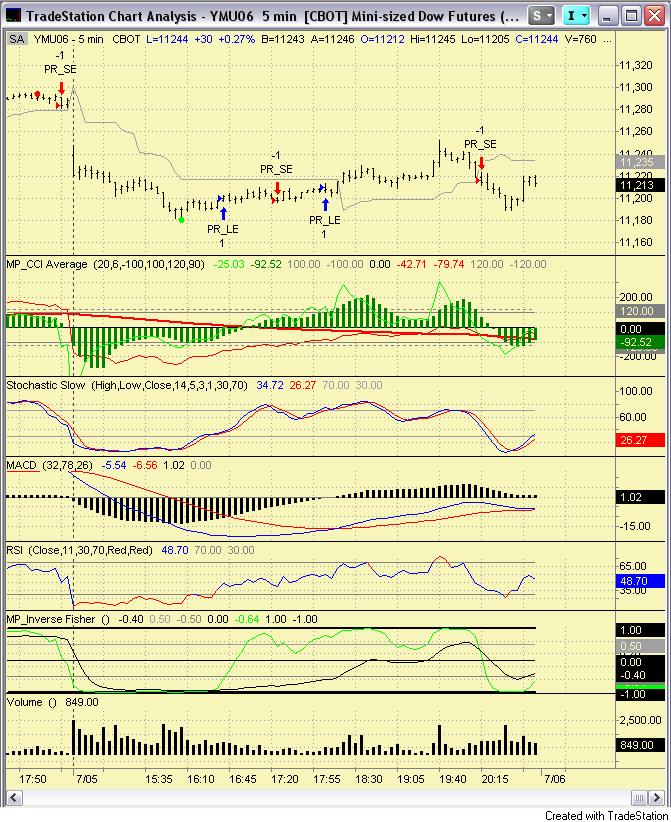
Dow dis not move much. In fact, it traded sideways today.

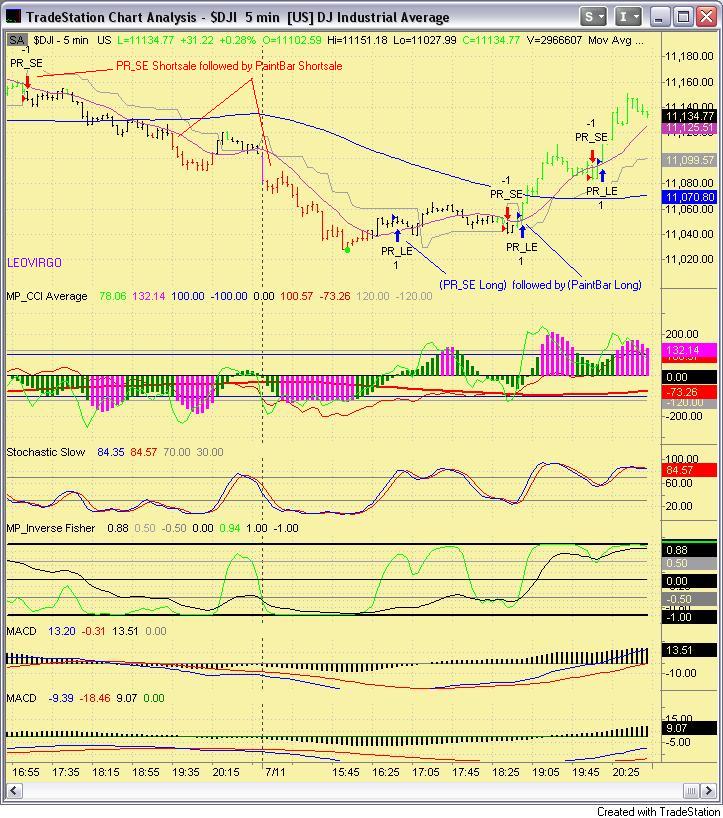
PaintBar system and PR_LE and PR_SE system suffered some losses as they are meant to be momentum catchers.

So in order to maintain equity curver nice and smooth, a new strategy is being tested to trade Nasdaq stocks.

It uses VWAP and mean reversion theory. So, it exploits the extreme situation to catch the correction path for small profits.

In order to be market neutral i. e, to hedge positions, two positions will be taken at the same time when the broadmarket i.e Dow, S&P are moving sideways, not more than 50 points from the open.

PaintBar strategy is also added to increase the probability of achieving two winning trades.

For today, at least two trades are possibe as soon as the market opens.

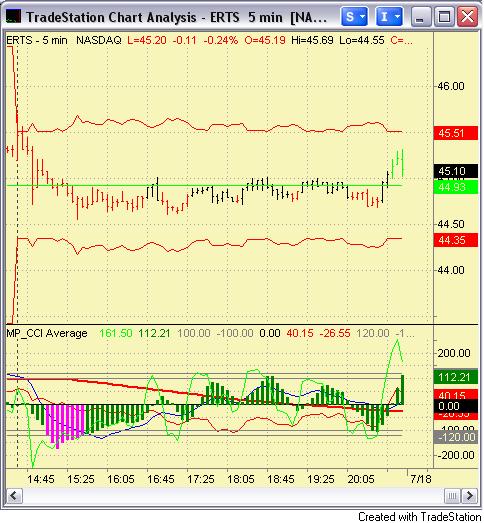
Short ERTS during first 2 bars


Short ERTS @45.50 for 50p target

Long SBUX during the first 2 bars

Long SBUX @33.60 for 40p target

Wednesday, July 12, 2006

From scalping signals to swing trades

Scalping signals in 1 min chart
System generated short signals in 1min chart at 11130 and later at 11116, see the chart above.

Initially they were scalping signals. Daily chart showed weakness albeit in a bullish territory.

Later shortsale signals appear in 5min chart, see the chart below.

The rest is follow the paintbars all the way down until it ( YMU06 futures ) hit FOMC day gap at 11050.

Swing trade signals in 5 min chart


Lessons
  1. Keep the faith in the system
  2. Adopt Champion Spirit ( that means keep the freebie trade to let the profits run )

Shortsale trades at Cable were also profit-limit trades. Need to let the winners run.

All in all, a good day.

TOTAL GAINS = 92 points

Tuesday, July 11, 2006

Signals in action

Dow moved in swings and our system captured 90% of the moves.

Today, we started with a shortsale. The opening bar itself was a 5 Star System Shortsale.

Dow couldn't break 11040-60 resistance area and then we got a Long signal ( PR_SE blue arrow) .

There was a bit of dilemma as we saw a PR_SE short entry but it was a weak signal as our very own "momentum" was bullish so we stayed Long.

Then just after 6.30pm we got a PaintBar Long Entry ( Green Bars ). So, two strategies working together must be a really strong signal.

PaintBar System stayed green all the way although PR_LE and PR_SE signals appeared during the second round of rally.

Since 10th July PR_SE short signal, the results are

Short = + 100 points
Long = + 80 points

Our system is well suited with a high degree of 'volatility'.

Monday, July 10, 2006

Paint Bars system for DJ30

Buy = when there is a green bar, Sell out when there is a normal Black bar.

Shortsale = when there is a red bar, Buy to cover when there is a normal black bar.

PR_LE and PR_SE are signals from the second system which are also easy to use. Buy on blue arrow and SELL on red arrow. They appear in real time.

See the following chart :


Friday 7th July 2006 system trades

  • Short 11160, max run up +20 pts but settled for break even.
  • Long 11160, Short exit at 11146. ( Loss -14 pts )
  • Short 11146, max run up + 80 pts, but out with Long entry at 11082 for 64pts profit.

Friday TOTAL GAINS = 50 pts.

Friday, July 07, 2006

Avoid small moves


Trading YMU06 system signals for Thursday :
11243 Long11268
Short ( +25 pts)
11288 Long ( -20 pts )
11308 Short ( +20 pts )
11298 Long ( + 10 pts )
11290 Short ( - 8 pts )
11284 Long ( + 6 pts )
11268 Short ( -16 pts )
111290 Long ( -22 pts )

TOTAL -5 pts LOSS.

Summary

The early upside push was exhausted at 5pm. The momentum break out signals thereafter were not reliable. So, I traded selectively and my P/L was +19 pts.

I did not take the short trade from 11308 but it was a runner. Max run up for +30 points.

Had I trade with SuperTrend

Long 11243, Exit 11282. ( + 39 points, Max run up 11320 = + 80 pts,)

Long 11298 Short 11290 ( - 8 pts )

Thursday, July 06, 2006

Dow fell on Monday


Yesterday's system signals for YMU06 futures -

Monday closing Short 11280

Buy to cover and went Long 11202. ( + 78 pts )

Short 11197 ( - 5 pts )

Long 11210 ( - 17 pts )

Exit Long 11220 ( + 10 pts )

Short 11216 - BreakEven Exit on close.

Total 66 points gain.