Google

Tuesday, May 30, 2006

Keep the faith and follow the system


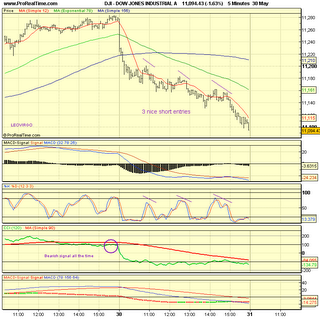
Today, our trading system was shouting "sell, Sell, SELL". These are the sell signals:

  • 30min CCI bearish since late Friday
  • CCI crossed under CCIMA at today's opening down move
  • Striker was heading down

The only thing that was bullish was 5min momentum. But the signal line is clearly in the negative at -20.

The system recommended three short entries- stochastics crossed down three times and all of them were profitable short entries.

In order to follow the system successfully,

  • Follow the 30min CCI direction and enter trade in this direction (Shortsale for today)
  • Use 5min stochastics for entries
  • NEVER GUESS TOPs AND BOTTOMs.
  • NEVER ASSUME A REVERSAL UNTIL THE SYSTEM SAY SO
  • Forget the market gurus' predictions and other noises. The system will capture the market's actual moves.
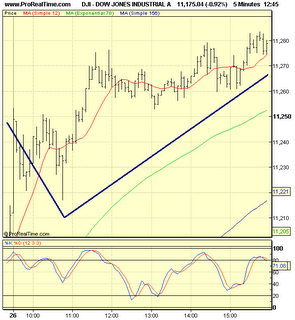
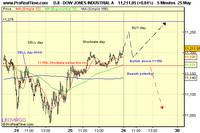
Revisiting previous analysis for Dow Day trading


Dow traded as expected in the pre-market analysis last Friday. There was a small decline followed by a steady rally.

The momentum weakened as the day progress and it lead to today's fall.

Friday, May 26, 2006

Possible trend change for DOW


Well, yesterday's shortsale day signalled a possible trend change. Dow traded higher and shortsale came in late and it was a higher shortsale. That means the decline did not go much lower than previous day's high (Decline from 11200 to 11164). Then it turned back upward to the close.

Today is BUY day.

Trend change signal will be confirmed if the prices trend higher.Expected play is to go higher in the first hour then followed by a small decline, not below 11160. From there, a strong rally should take place. If not, the major down trend is stil in place.

This is what Taylor trading technique says about today's possible market move.

Thursday, May 25, 2006

Live Dow trading entries


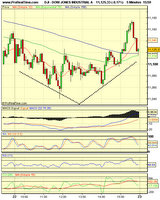
Here is the chart for yesterday. There are two clear entries- one Long and one Short, each netting a minimum of 30points. The short trade can use trailing stop to capture maximum down move (total decline 100 points). This is the plain version.

I am using Bollingger Bands in 30min chart. The system in short is..

  • Enter in the direction of 30min chart BBMA trend
  • Be alert when the price pulls back to BBMA line
  • Enter when stochastics in 5min chart crosses up/down
  • Target exit when the price penetrates the up/down channel line in BB

Again, the key here is to have 'patience' until there is a clear signal.

Wednesday, May 24, 2006

Shortsale day for Dow Jones Index

Tomorrow is shortsale day. I know that it is rallying from 11040 double bottom. But on a shortsale day, a nice shorting opportunity can be found, ususally 30-70 points for Dow. If there is an afternoon rally with just a mild decline in the earlier part, then this would be a sign of trend change. The immediate trend is to go higher. If the markets is ranging within 40 points for most of the time, then it is usually followed by a nice decline on the next day.

DOW may be heading below 11000


Last night's after hours decline was a sign that the markets are still very nervous. It broke down the upward channel of recovery.

Daily chart weakness
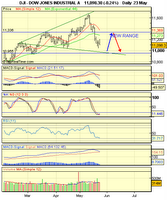
On a daily chart, there is a Wolfe Wave pattern which begins from 11600+ and then the target is around 11000 or even below that depending on when the bottom will be found. This is something to bear in mind when trading but following the technical indicators is the best way.

10day average bull-bears indicator shows the bears are getting weaker. That means, on a longer term view the market bottom is not far away. Big players want people to be afraid and sell, then the bounce may come in with full power.

Bull-bear battle= volatile day
Today is Selling Day. Yesterday's closing was extremely weak. TMI is side but the figure is in the negative. That shows the underlying weakness.

Trade plan for today

Shortsale with a view to find market bottom.

Monday, May 22, 2006

V shaped Shortsale day


As expected in the pre-market earlier post, it really was a v-shaped SS day.

Selling continued in the first half of the day followed by up-side breakout all the way to 11175.

When momentum is holding above zero and the stochastics cross up, the uplift power gathered forces and the down trend was reversed, at least temporarily.

For tomorrow

Selling may continue but should not be too much.

BUY above 11040.

Technical bounce possible

Friday's closing was neutral with closing % at 65.39. Temporary trend TMI was UP however, the medium term bull-bear strength at -199.10. The DOW may be due for a technical bounce but it may re-test the lows of last week.

According to TTT, it is Shortsale Day that means there could be a nice shorting opportunity. We will be looking for a nice short entry but will be cautious for a strong re-bound which would result in a V-shaped SS day.

Friday, May 19, 2006

Welcome to our DOW trading system


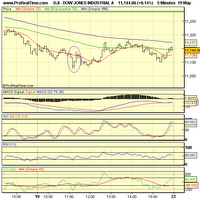
We have tested our system today. The DOW was very turbulent as it was OEX Option Expiry day. It moved 60points down and 70 points up just in 20 minutes. See that purple circle after 11:00am.

Later part of the day, it was really testing the bottom and then trying to come back to the EMA line.

DOW has fallen more than 500 points since the FOMC meeting on 10 May 2006.

For Monday 22 May 2006, it is still in BUY territory. However, entry should be carefully taken.