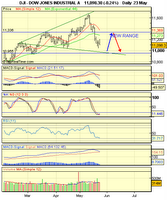
Last night's after hours decline was a sign that the markets are still very nervous. It broke down the upward channel of recovery.
Daily chart weakness
On a daily chart, there is a Wolfe Wave pattern which begins from 11600+ and then the target is around 11000 or even below that depending on when the bottom will be found. This is something to bear in mind when trading but following the technical indicators is the best way.
10day average bull-bears indicator shows the bears are getting weaker. That means, on a longer term view the market bottom is not far away. Big players want people to be afraid and sell, then the bounce may come in with full power.
Bull-bear battle= volatile day
Today is Selling Day. Yesterday's closing was extremely weak. TMI is side but the figure is in the negative. That shows the underlying weakness.
Trade plan for today
Shortsale with a view to find market bottom.

No comments:
Post a Comment