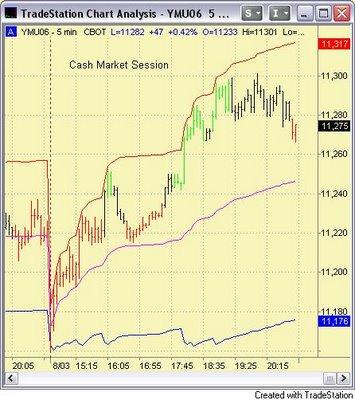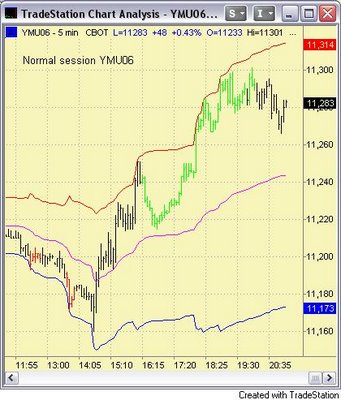

Two charts for YMU06 on the same day. The first one is based on Dow cash market sessions i.e, without pre-market hours.
The second one is plotted on regular futures session, i.e including all of out-of-market actions.
UK and EU raised interest rates and as a result FTSE and Euro markets suffered.
Dow also fell heavily in the opening bar but quickly regained strength and closed higher for the day.
What are the differences in PaintBar signals...?
Regular session chart
- It reflects the main sentiment of the day
- No RedBar so no shortsale signal
- Timely Long entry with GreenBars, if taken near VWAP
- Just one trade - Go Long
Cash market session chart
- It printed RedBars and stopped out twice
- Long entry was late
Why?
Is it just curve fitting? No, it may well be highlighting the importance of pre-market hours information.
The regular session chart would have prevented another Shortsale entry which were taken based on cash market hours chart.
It is better to check with regular session chart if the Opening bar trade is to be taken.

No comments:
Post a Comment