Google

Monday, October 23, 2006

VWAP Buy for Trending days

DOW was trending higher, +50 points up after a brief deline.

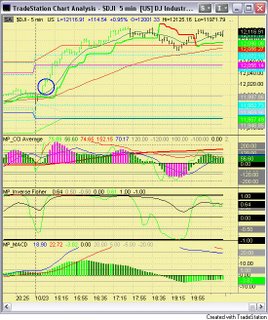
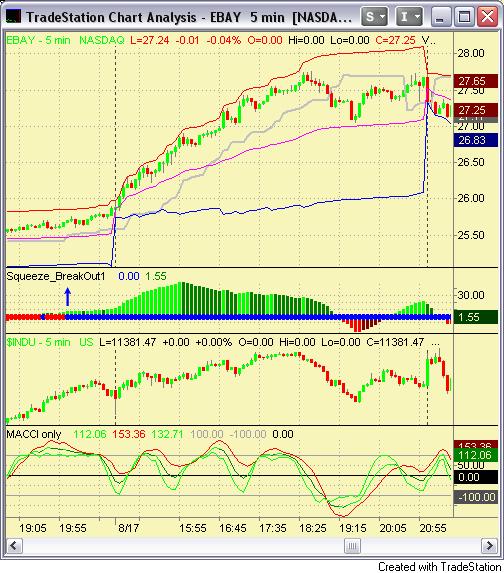
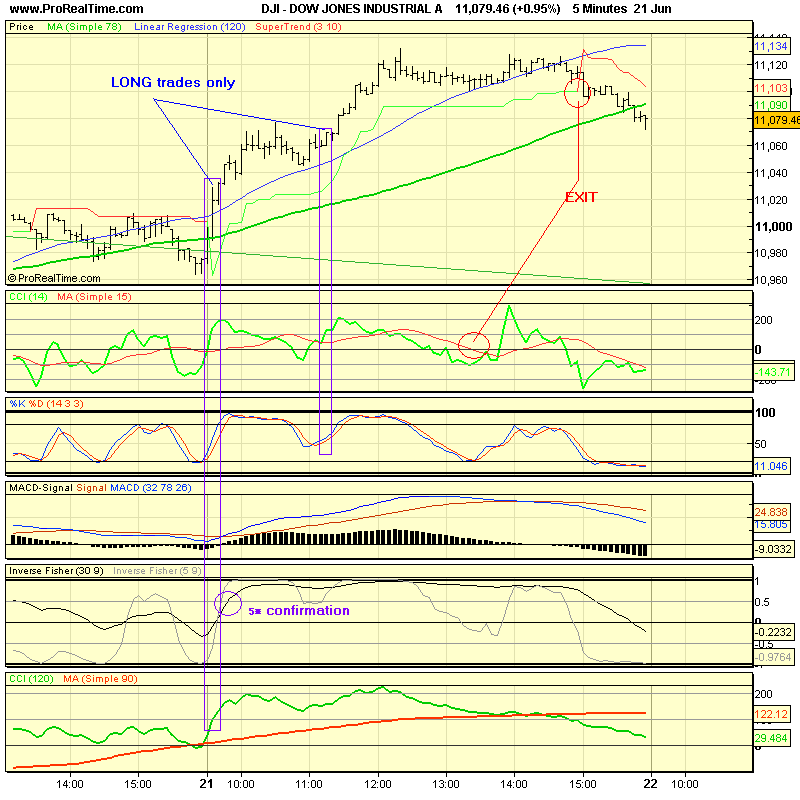
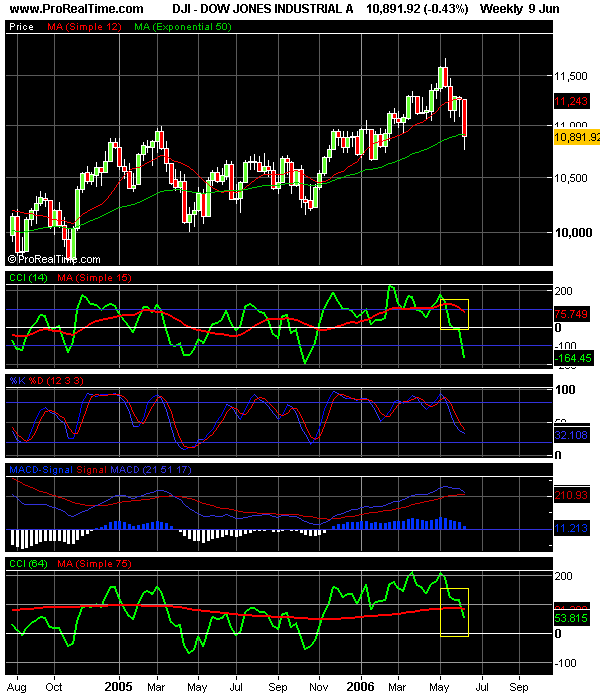
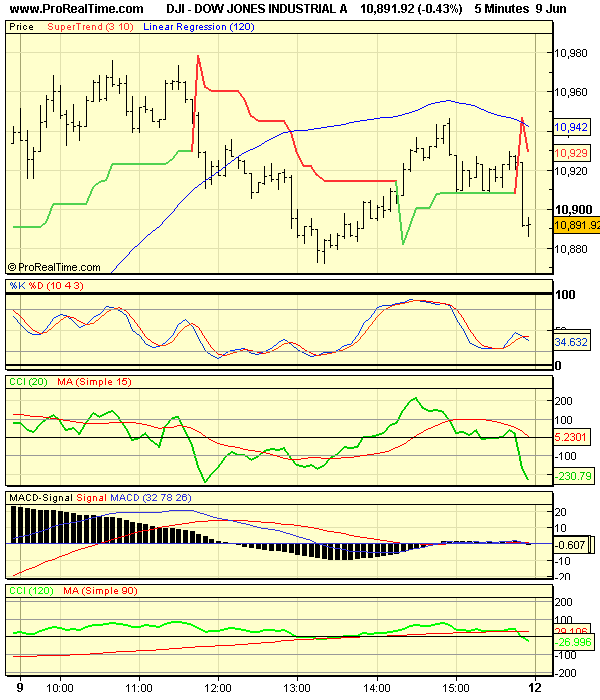
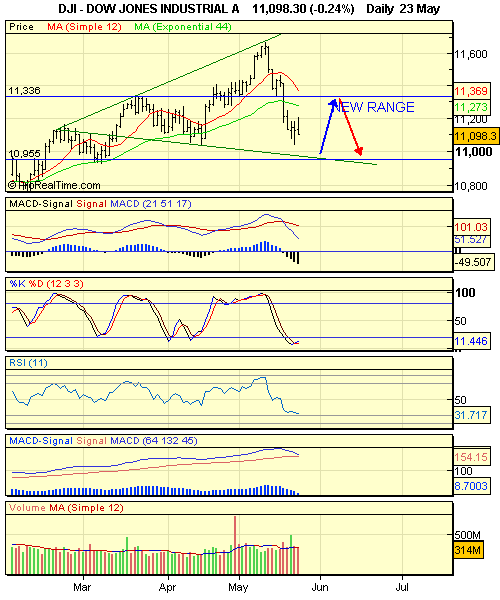
MACD histogram (momentum) signals also went up suddenly, normally it signals a change in direction. This time, it is an UP move.

Thus it would call for going LONG in stocks. $INDU also gave LONG signal.

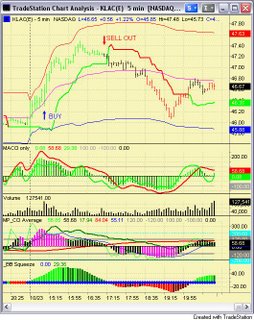
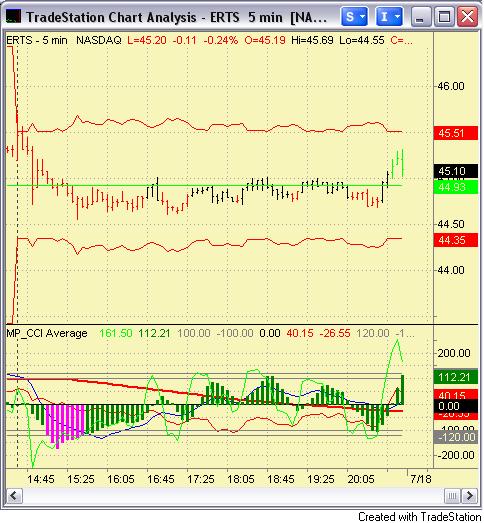
The stock with BUY signal was KLAC. As it was a trending day buy, VWAP BUY should be used.

VWAP Buy features

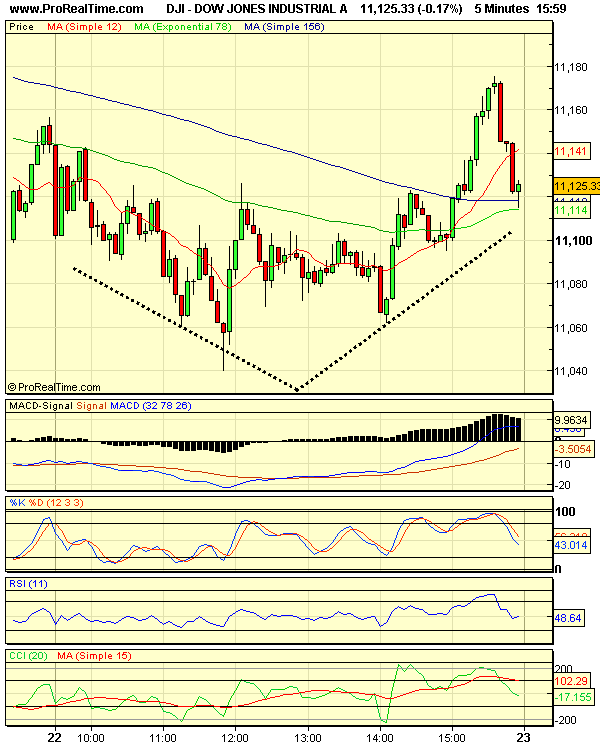
  • Green bars + Green ST + below VWAP in 5min chart
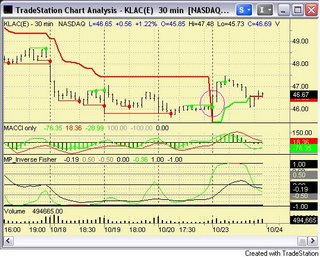
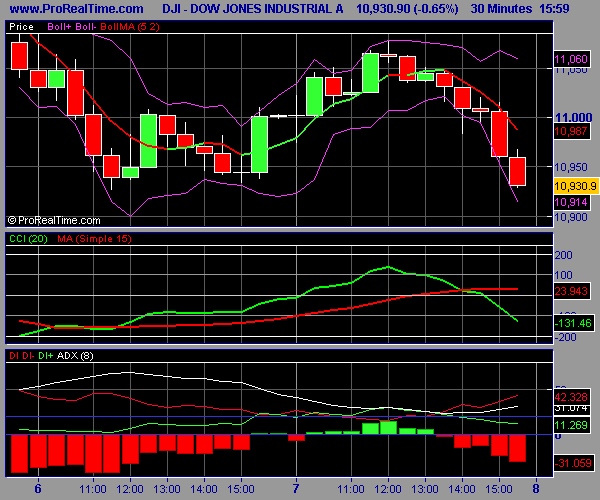
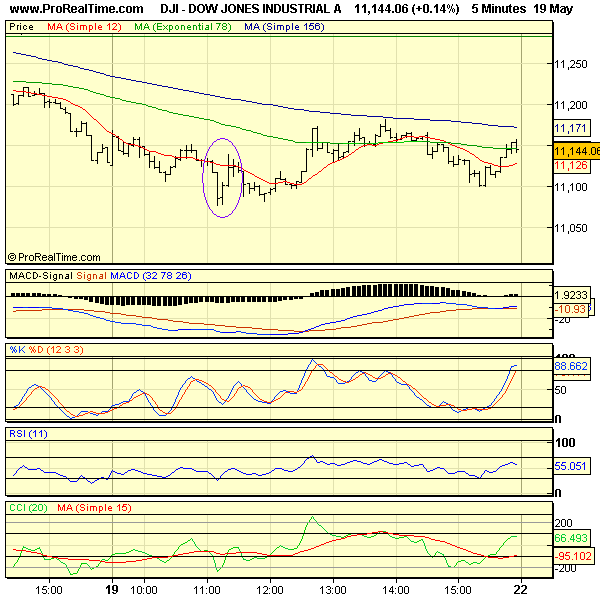
  • Above SuperTrend in 30min chart
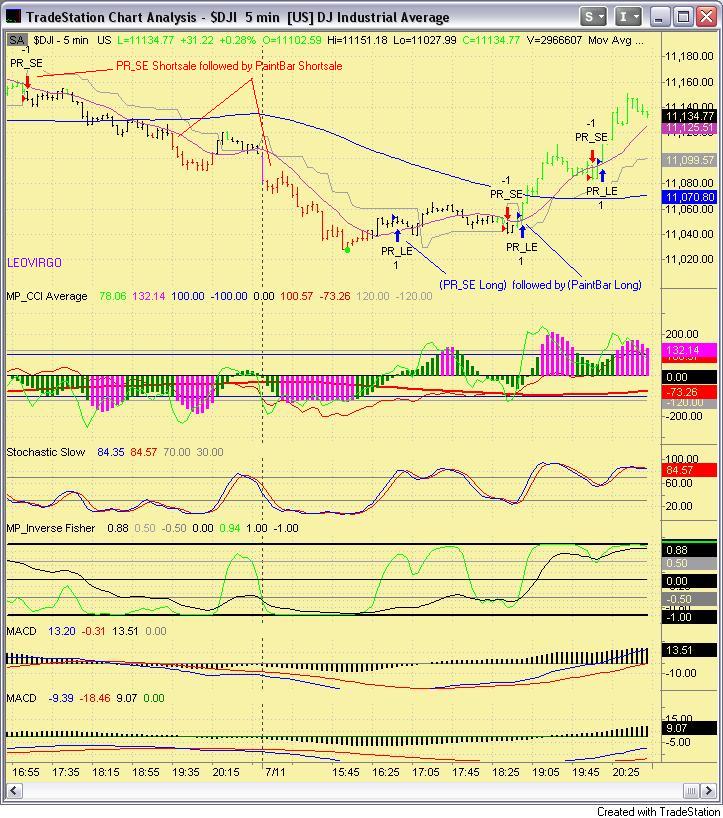
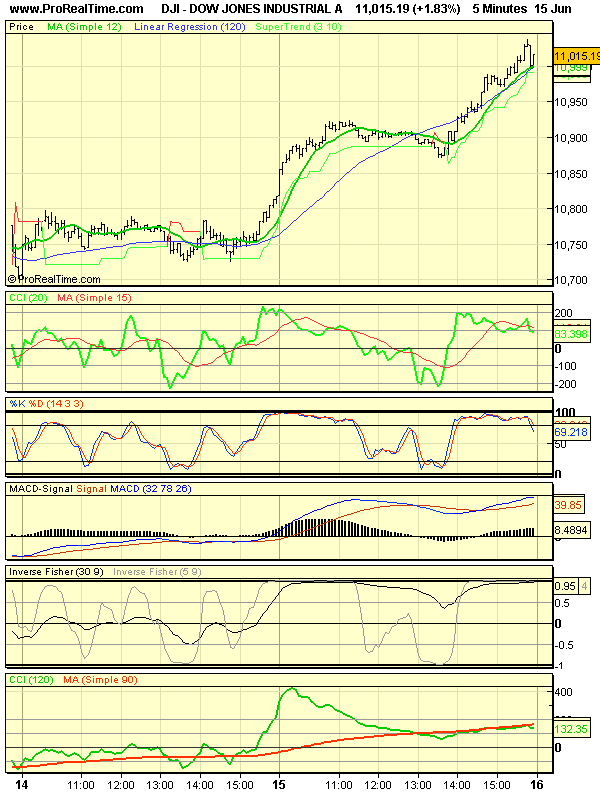
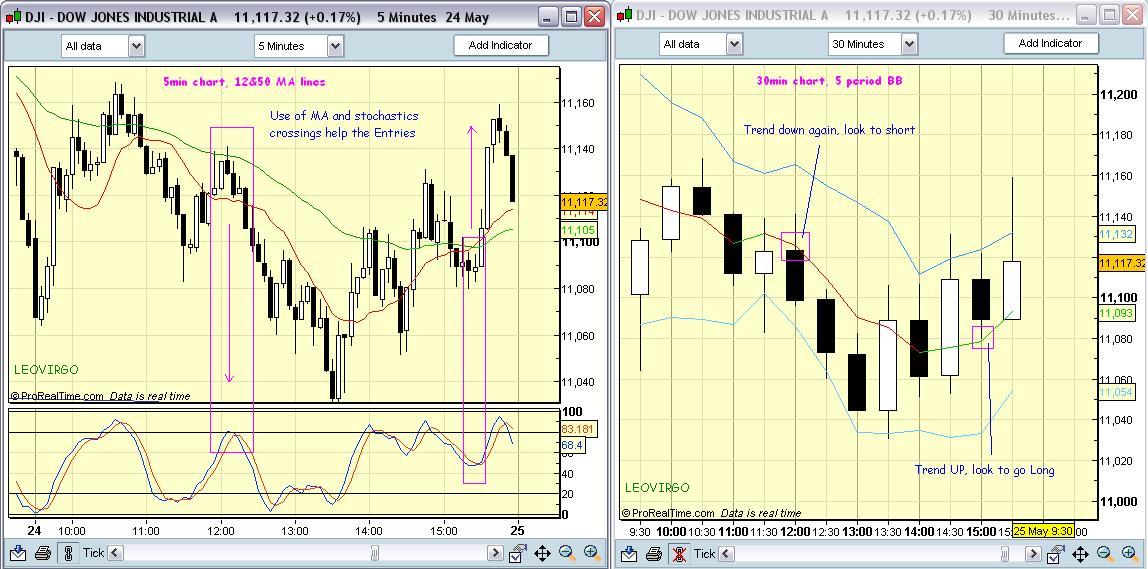
5-min chart

Buy and Sell signals are clearly marked with arrows.
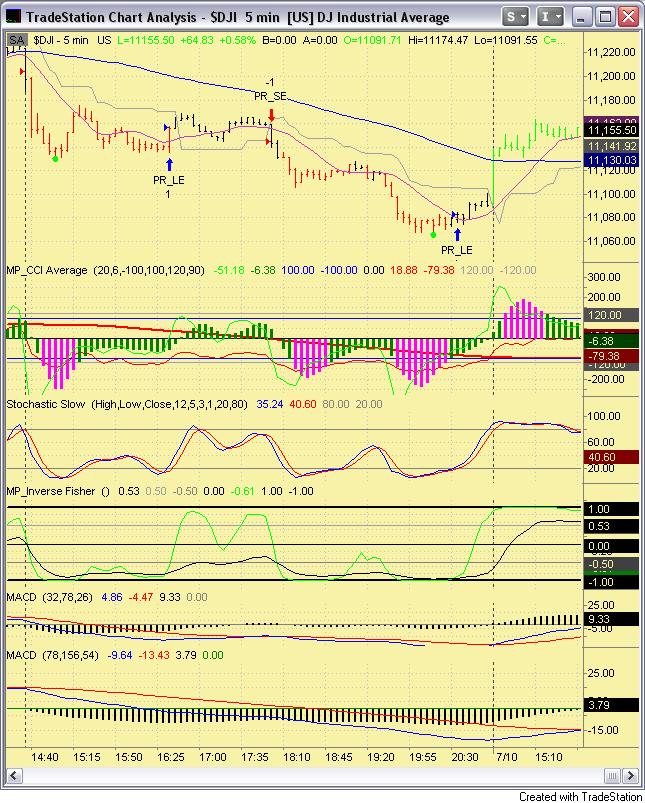
30min chart

Note that SuperTrend was switched at 3:00pm. It allowed for LONG entries in 5min chart.

SuperTrend switch in 30 min charts are very important signals.

Thursday, August 31, 2006

Mean reversion

AMGN was so technically efficient today. Long Entry (green bars) in the early part, then broke down below SuperTrend and Short Entry ( red bars ).

Lower MPD band to VWAP

Go Long when large volume picked up while prices remained below lower MPD band. Earlier penetrations didn't have large volume.

Target is at VWAP. 50 cent profits for less than one hour's trading.

Thursday, August 24, 2006

Breakout

This is Ebay against $INDU on 17th August. Ebay was going higher and higher and closed up for more than 6%.

Ebay had been a strong stock prior to this. The breakout happened late 16th. It has to be an overnight trade.

How to join the rally on the 17th?

Entry

Take the long trade whenever $INDU completed a downturn and up again.

Note the followings:

  • $INDU was never OS(oversold) in multi-MACCI settings
  • Ebay's rally was followed through with high volumes and Ebay was never OB(overbought) in the context of the MPD, in otherwords, Ebay never went outside the upper MPD band

Thursday, August 03, 2006

Spot the difference


Two charts for YMU06 on the same day. The first one is based on Dow cash market sessions i.e, without pre-market hours.

The second one is plotted on regular futures session, i.e including all of out-of-market actions.

UK and EU raised interest rates and as a result FTSE and Euro markets suffered.

Dow also fell heavily in the opening bar but quickly regained strength and closed higher for the day.

What are the differences in PaintBar signals...?

Regular session chart

  • It reflects the main sentiment of the day
  • No RedBar so no shortsale signal
  • Timely Long entry with GreenBars, if taken near VWAP
  • Just one trade - Go Long

Cash market session chart

  • It printed RedBars and stopped out twice
  • Long entry was late

Why?

Is it just curve fitting? No, it may well be highlighting the importance of pre-market hours information.

The regular session chart would have prevented another Shortsale entry which were taken based on cash market hours chart.

It is better to check with regular session chart if the Opening bar trade is to be taken.

Thursday, July 27, 2006

Risk assessment with MPD bands


Signals for YMU06 were tested using VWAP and MPD bands to filter out any risky entries.

The first two signals ( one Long, one Short ) were stopped out as these positions were taken near MPD bands.

But the third signal to Short worked the wonder. The signal appear in the neutral area, near VWAP itself.

Risk assessment with MPD bands should be implemented.

Monday, July 24, 2006

Momentum Exhaustion Exit or MEEP

Exit is as important as Entry. We've had a working Entry System but Exit System was a mystery until recently.

We could use SuperTrend to follow the trend but it does not point to the Most Efficient Exit Point (MEEP).

Thanks ot Grey1 ( who is moderating TT thread on T2Win site), I am now applying multi TimeFrame exhaustion as one of the exits method.

Here is the trade


  • Sellshort entry @ 11015. ( Open after one Red Bar print )
  • Exit @10868. ( exit after system generated blue dot signal )

147 points profit. And then another chance to enter a new trade.


Such an awesome signal ................ backtesting was also satisfactory, except for the Longs where the rally often continues.

At least one solution is with me now.

Tuesday, July 18, 2006

VWAP strategy

Dow dis not move much. In fact, it traded sideways today.

PaintBar system and PR_LE and PR_SE system suffered some losses as they are meant to be momentum catchers.

So in order to maintain equity curver nice and smooth, a new strategy is being tested to trade Nasdaq stocks.

It uses VWAP and mean reversion theory. So, it exploits the extreme situation to catch the correction path for small profits.

In order to be market neutral i. e, to hedge positions, two positions will be taken at the same time when the broadmarket i.e Dow, S&P are moving sideways, not more than 50 points from the open.

PaintBar strategy is also added to increase the probability of achieving two winning trades.

For today, at least two trades are possibe as soon as the market opens.

Short ERTS during first 2 bars


Short ERTS @45.50 for 50p target

Long SBUX during the first 2 bars

Long SBUX @33.60 for 40p target

Wednesday, July 12, 2006

From scalping signals to swing trades

Scalping signals in 1 min chart
System generated short signals in 1min chart at 11130 and later at 11116, see the chart above.

Initially they were scalping signals. Daily chart showed weakness albeit in a bullish territory.

Later shortsale signals appear in 5min chart, see the chart below.

The rest is follow the paintbars all the way down until it ( YMU06 futures ) hit FOMC day gap at 11050.

Swing trade signals in 5 min chart


Lessons
  1. Keep the faith in the system
  2. Adopt Champion Spirit ( that means keep the freebie trade to let the profits run )

Shortsale trades at Cable were also profit-limit trades. Need to let the winners run.

All in all, a good day.

TOTAL GAINS = 92 points

Tuesday, July 11, 2006

Signals in action

Dow moved in swings and our system captured 90% of the moves.

Today, we started with a shortsale. The opening bar itself was a 5 Star System Shortsale.

Dow couldn't break 11040-60 resistance area and then we got a Long signal ( PR_SE blue arrow) .

There was a bit of dilemma as we saw a PR_SE short entry but it was a weak signal as our very own "momentum" was bullish so we stayed Long.

Then just after 6.30pm we got a PaintBar Long Entry ( Green Bars ). So, two strategies working together must be a really strong signal.

PaintBar System stayed green all the way although PR_LE and PR_SE signals appeared during the second round of rally.

Since 10th July PR_SE short signal, the results are

Short = + 100 points
Long = + 80 points

Our system is well suited with a high degree of 'volatility'.

Monday, July 10, 2006

Paint Bars system for DJ30

Buy = when there is a green bar, Sell out when there is a normal Black bar.

Shortsale = when there is a red bar, Buy to cover when there is a normal black bar.

PR_LE and PR_SE are signals from the second system which are also easy to use. Buy on blue arrow and SELL on red arrow. They appear in real time.

See the following chart :


Friday 7th July 2006 system trades

  • Short 11160, max run up +20 pts but settled for break even.
  • Long 11160, Short exit at 11146. ( Loss -14 pts )
  • Short 11146, max run up + 80 pts, but out with Long entry at 11082 for 64pts profit.

Friday TOTAL GAINS = 50 pts.

Friday, July 07, 2006

Avoid small moves


Trading YMU06 system signals for Thursday :
11243 Long11268
Short ( +25 pts)
11288 Long ( -20 pts )
11308 Short ( +20 pts )
11298 Long ( + 10 pts )
11290 Short ( - 8 pts )
11284 Long ( + 6 pts )
11268 Short ( -16 pts )
111290 Long ( -22 pts )

TOTAL -5 pts LOSS.

Summary

The early upside push was exhausted at 5pm. The momentum break out signals thereafter were not reliable. So, I traded selectively and my P/L was +19 pts.

I did not take the short trade from 11308 but it was a runner. Max run up for +30 points.

Had I trade with SuperTrend

Long 11243, Exit 11282. ( + 39 points, Max run up 11320 = + 80 pts,)

Long 11298 Short 11290 ( - 8 pts )

Thursday, July 06, 2006

Dow fell on Monday


Yesterday's system signals for YMU06 futures -

Monday closing Short 11280

Buy to cover and went Long 11202. ( + 78 pts )

Short 11197 ( - 5 pts )

Long 11210 ( - 17 pts )

Exit Long 11220 ( + 10 pts )

Short 11216 - BreakEven Exit on close.

Total 66 points gain.

Friday, June 30, 2006

Backtesting EW system

The chart above is Long entries since 28th evening break out time.

Back testing results

The EW system is generating live signals. They are not automated as yet.

Results from back testing over the last three weeks are quite satisfactory. Here are the results from 8 June to 29 June:

Long Trades

  • Total 16 trades;
  • Winning Trades 11, Losing trades 5, BreakEven trades 0;
  • Max win points in a trade : 128. Max loss trade (-22);
  • Consecutive winning trades 5, consecutive losing trades 2;
  • Average win/trade 52 pts, average loss/trade 21;
  • Total win points 572, total loss points -104;
  • Net winning points = 468.

Short Trades

  • Total 45 trades;
  • Winning Trades 19, Losing trades 16, BreakEven trades 10;
  • ( BreakEven trades is triggered when the profits floor of 20 points was reached and then come back to EntryPrice )
  • Max win points in a trade 123, max loss trade - 38;
  • Consecutive winning trades 7, max losing trades 3;
  • Average win/trade 33, average loss/trade 13;
  • Total win points 629, Total loss points 211;
  • Net Winning points 418;

TOTAL NET GAINS = 886.

Thursday, June 22, 2006

The market is always right

It was a weak BUY day.

Leo was buying with "expectations" without a valid signal from my system.

Our system suggested a decline to 11026, and the BUY number is 10989.

If momentum was strong enough, the system would give a signal at higher prices .

Momentum was weak & should have waited until the bearish pressure is exhausted.

Long 11030 (still open).

The system gave a Short signal at 11040, that was the only valid signal for today.

If it doesn't rally in the early session tomorrow, it has to be closed. 11040 resistance is the key again.

Repeat " expectations are not trading signals".

Just to recap the system trading:

  • No guessing tops and bottoms
  • No predicting the targets
  • No signal, no trade
  • Failed signal, immediate exit
  • Protect the capital in a working trade
  • Take what the system delivers, be it the profits or the loss
  • Catching a trend is easy, riding the trend is difficult as it takes calm mind not to take easy profits

The system will deliver consistent profits, there is no limit to the amount of returns. However, risk must be defined and limited.

Wednesday, June 21, 2006

No shortsale please


Today was Shortsale day. Yesterday was SELL day and the closing was weak, thus it was NOT EXPECTED to see it testing yesterday's highs of 11030.

But DOW defied expectations, as the markets will always do, being independent from analysts.

It reached 11030 in the first 10 minutes, setting a very bullish tone.

Our system signalled Long entry, later confirming the move as a 5 Star trending move. All we had to do was place a break-even oreder and follow the trend, placing trailing stops at Super Trend support line.

Another Long entry above 11060 pushing the prices to 11130+.

This kind of shortsale day rally is a very bullish behaviour. We can 'expect' the market to go even higher in the coming days.

But, 'expectations' are not trading signals. We must follow the system.

Let's give ourselves a little bit of stress free trading environment.

Tomorrow = BUY day

CCI is set for a bull run as long as slow MACCI line is above 100 line.

Any dip should be bought into.

Daily chart

This 11,130 is 50-day EMA. Will it break out? But 50-day SMA is at 11,208, so some more room for the upside.

Daily chart reading says it can go higher but bearish pressure is still following it as it looks like it will meet resistance at high prices.

Friday, June 16, 2006

Dow NR7 day

Today was narrow range day (61pts, not so bad but quite low comparatively).

Caught up in a couple of false break outs, momentum break outs did not work well on this kind of day.

The shortsale part of the day came very late.

Monday is BUY day in TTT but.......

Because of today's weak closing, we can expect a low made first on Monday (around 10985, today's low).

The daily chart points to a technical resistance at 11040, the downside is at least 100 pts.

Besides, NR7 day may be followed by a trending day.

If the decline does not go below 10985, look to go Long on momentum strength, otherwise to go short.

So.. decided to keep the short trade open for Monday. Stop order at 11044. This is very important number in daily chart.

We are "Strictly System Trading" but this daily chart is for guidance.

There are two reasons for a steep decline:-

  1. Touching the upper channel line of downward trend
  2. Head and shouder neck line re-test and decline

For further upward rally:-

  1. Large volume picking up on the bounce

Let's see...


Thursday, June 15, 2006

Dow reached higher prices

Just as expected, DOW is making follow through to higher prices. Yesterday's up trend is locked with super trend +120 points.

There was a bit of shake out and then it moved on.

The up trend continued all the way to 11030+. A very nice up trend, from 10750+ to 11030, 280 points!

5 Star System entry delivers the results.

Tomorrow is Shortsale day.

But in the uptrend, the second part of the day is often bullish, it would mean a very bullish situation which would last for at least another week.

Two day rally was abit parabolic. We might get a nice shortsale tomorrow.

Wednesday, June 14, 2006

Buy day for DOW


Today was BUY day but the buying power came quite late. There was a number of buy attempts in the earl but they were heavily sold off.

We took a short trade when it breached super trend support. But later it was stopped out as the decline did not materialise into a proper down trend.

Last hour buying was much more convincing and a long trade was taken @10750+, exited the trade @10790+. A bit too early, but still not convinced about after hour trading.

It was frustrating to get caught up in the whipsaws but BUY days in the beginning of a trend are usually late buying days.

News impact

CPI came higher than expected- core rate 0.3%, expected 0.2%. But the market did not fall to pre-market levels of 10660s.

Tomorrow is SELL day but today's closing was 99%. A follow through to higher prices is expected for tomorrow.

Tuesday, June 13, 2006

Bulls vs Bears power struggle


Today was shortsale day.

In the system view, today was really a struggle between bulls and bears. Yesterday's down trend was interrupted when the prices broke out above super trend at 10820.

Out of market prices went down as low as 10750, perhaps an indication of the market's bias.

Nevertheless, there was a short entry @10800 which deliverd about 40 points

We missed second short entry @10780. The main reason for passing that trade was simply because long-term CCI staying above long-termCCIMA. It did not cross down convincingly, a sign of technical resistance.

What happened next was not magic. Prices bounced hard & rallied 100 points. We took the long trade, out before it hit 10800. It wasn't meant to be a trend trade.

The last 100 points decline was a surprise.

Tomorrow = BUY day

Monday, June 12, 2006

5 Star System Shortsale DOW Index


Dow traded lower prices as indicated by the Friday's closing. A weak closing on BUY day is usually followed by Buy Day Low Violation on SELL DAY (per Taylor's Book Method)

Today was SELL DAY. No surprise. Dow ended 99 points lower.

Technically, there were two scalp shorts in the early session. Our system shouted SELL in the second session after lunch time.

Early Warning System identified a Short entry and it was confirmed by 5 Star System.

A nice decline went for 100+ points.

Our system demands courage to follow it, especially when the trade is in substantial profits.

Take emotion out of trading. To be successful in trading, the attitude towards money has to be adjusted.

We take as much profits as the system delivers.

Friday, June 09, 2006

Serious technical damage in Blue Chip Index Dow

In weekly Dow chart, it is resting right on 50 week moving average line. CCI lines crossed down CCIMA lines.

The fast CCI line hesitated on Zero line for two weeks but this week was the penetration to the negative side. It is now -164.45 as seen in the chart.

The slow CCI line also crossed into MA line. It crossed up in November last year which resulted in 6 months bull run.

Now it just crossed down. Unless it is not rejected in two weeks' time, Dow will head into the bear trend which may last a few months.

Bull side

  • 50 wk MA line support
  • Stochastics near over-sold (a bit pre-emptive to say that)

Bear side

  • fast CCI line cross down Zero line
  • slow CCI line cross down for the first time in more than six months
  • MACD losing momentum

Unless it can come back above 11243, we favour more down side.

Trading DOW : Bearish BUY day

Bullish attempts failed when the prices broke down below Super Trend(ST) support line. Yesterday's LONG at 10855 gave us +80 points.

Today is range day in technical terms because long-term CCI could not penetrate above 100 line and this rejection made MACDHistogram Momentum's bearish move in charge.

Midday, prices reversed the trend. But broke down below ST again.

Tomorrow: SELL day

We can expect breach of today's low as the closing was weak on Buy day. Today was NR5 day as well. Some bearish pressure will force the index to trade lower. It may recover from lower prices though.

Thursday, June 08, 2006


What a nice day it turned out to be.

As expected in the previous post, there was a nice short entry and the decline was swift and ruthless. Actually, as shown in the chart, the Shortsale signal came in late yesterday's session. Anyway, we entered the trade soon after the opening for a nice down trip.

But just as cautioned in earlier post, it turned out to be a V-shaped Shortsale day. On a shortsale day, this kind of behaviour is telling us that the buyers are stepping in. Biggies are changing their portfolios whatever it may be. For a swing trader, it says tomorrow is important. heehe everyday is important. If there is just a small decline in the earlier session and the prices break out to the upside, then it is a Long entry. If not, .. yes, it is still in the down trend.

Tomorrow: BUY day

End of Day signal says there is a resistance. So look for an early decline, perhaps a small one, which can be another LONG entry.

Well, we don't guess tops and bottoms. Let the market decide. The Long entry at 10850 still holds. 30min CCI is around Zero line. If it penetrates north, a BUY day will be in action. Otherwise, CCI Zero Line Rejection will give us a nice short entry.

DOW: round trip day


BUY signal on the 6th June delivered 100+ points. But it did not last long. CCI rejection at +100 level gave a reverse signal, with a SHORT confirmation at 11000 area when CCI crossed under CCIMA (the red line).

This morning, the futures were traded below 10900 level, which was -100 points after the SHORT signal.

Today is Shortsale day. In the downtrend, the only thing to be cautious is V-shaped shortsale day. Otherwise, look for a SHORT entry with a view to cover tomorrow, Friday when the prices hit a new low.

Tuesday, June 06, 2006

Dow has fallen 700 points


Today marks the completion of downward Wolfe Waves. As shown in the above chart, Dow has fallen from the highs of 11670 to the lows of 10926. As we stated in the earlier post, Dow actually broke 11000 barrier.

Our system is reacting well to this week's sell-off. We have more confidence in the system than before. By the way, we will not sell our system. It is a discretionary system and can not be automated.

We wish everybody a successful trading career.

Tuesday, May 30, 2006

Keep the faith and follow the system


Today, our trading system was shouting "sell, Sell, SELL". These are the sell signals:

  • 30min CCI bearish since late Friday
  • CCI crossed under CCIMA at today's opening down move
  • Striker was heading down

The only thing that was bullish was 5min momentum. But the signal line is clearly in the negative at -20.

The system recommended three short entries- stochastics crossed down three times and all of them were profitable short entries.

In order to follow the system successfully,

  • Follow the 30min CCI direction and enter trade in this direction (Shortsale for today)
  • Use 5min stochastics for entries
  • NEVER GUESS TOPs AND BOTTOMs.
  • NEVER ASSUME A REVERSAL UNTIL THE SYSTEM SAY SO
  • Forget the market gurus' predictions and other noises. The system will capture the market's actual moves.

Revisiting previous analysis for Dow Day trading


Dow traded as expected in the pre-market analysis last Friday. There was a small decline followed by a steady rally.

The momentum weakened as the day progress and it lead to today's fall.

Friday, May 26, 2006

Possible trend change for DOW


Well, yesterday's shortsale day signalled a possible trend change. Dow traded higher and shortsale came in late and it was a higher shortsale. That means the decline did not go much lower than previous day's high (Decline from 11200 to 11164). Then it turned back upward to the close.

Today is BUY day.

Trend change signal will be confirmed if the prices trend higher.Expected play is to go higher in the first hour then followed by a small decline, not below 11160. From there, a strong rally should take place. If not, the major down trend is stil in place.

This is what Taylor trading technique says about today's possible market move.

Thursday, May 25, 2006

Live Dow trading entries


Here is the chart for yesterday. There are two clear entries- one Long and one Short, each netting a minimum of 30points. The short trade can use trailing stop to capture maximum down move (total decline 100 points). This is the plain version.

I am using Bollingger Bands in 30min chart. The system in short is..

  • Enter in the direction of 30min chart BBMA trend
  • Be alert when the price pulls back to BBMA line
  • Enter when stochastics in 5min chart crosses up/down
  • Target exit when the price penetrates the up/down channel line in BB

Again, the key here is to have 'patience' until there is a clear signal.

Wednesday, May 24, 2006

Shortsale day for Dow Jones Index

Tomorrow is shortsale day. I know that it is rallying from 11040 double bottom. But on a shortsale day, a nice shorting opportunity can be found, ususally 30-70 points for Dow. If there is an afternoon rally with just a mild decline in the earlier part, then this would be a sign of trend change. The immediate trend is to go higher. If the markets is ranging within 40 points for most of the time, then it is usually followed by a nice decline on the next day.

DOW may be heading below 11000


Last night's after hours decline was a sign that the markets are still very nervous. It broke down the upward channel of recovery.

Daily chart weakness
On a daily chart, there is a Wolfe Wave pattern which begins from 11600+ and then the target is around 11000 or even below that depending on when the bottom will be found. This is something to bear in mind when trading but following the technical indicators is the best way.

10day average bull-bears indicator shows the bears are getting weaker. That means, on a longer term view the market bottom is not far away. Big players want people to be afraid and sell, then the bounce may come in with full power.

Bull-bear battle= volatile day
Today is Selling Day. Yesterday's closing was extremely weak. TMI is side but the figure is in the negative. That shows the underlying weakness.

Trade plan for today

Shortsale with a view to find market bottom.

Monday, May 22, 2006

V shaped Shortsale day


As expected in the pre-market earlier post, it really was a v-shaped SS day.

Selling continued in the first half of the day followed by up-side breakout all the way to 11175.

When momentum is holding above zero and the stochastics cross up, the uplift power gathered forces and the down trend was reversed, at least temporarily.

For tomorrow

Selling may continue but should not be too much.

BUY above 11040.

Technical bounce possible

Friday's closing was neutral with closing % at 65.39. Temporary trend TMI was UP however, the medium term bull-bear strength at -199.10. The DOW may be due for a technical bounce but it may re-test the lows of last week.

According to TTT, it is Shortsale Day that means there could be a nice shorting opportunity. We will be looking for a nice short entry but will be cautious for a strong re-bound which would result in a V-shaped SS day.

Friday, May 19, 2006

Welcome to our DOW trading system


We have tested our system today. The DOW was very turbulent as it was OEX Option Expiry day. It moved 60points down and 70 points up just in 20 minutes. See that purple circle after 11:00am.

Later part of the day, it was really testing the bottom and then trying to come back to the EMA line.

DOW has fallen more than 500 points since the FOMC meeting on 10 May 2006.

For Monday 22 May 2006, it is still in BUY territory. However, entry should be carefully taken.