Google

Friday, June 30, 2006

Backtesting EW system

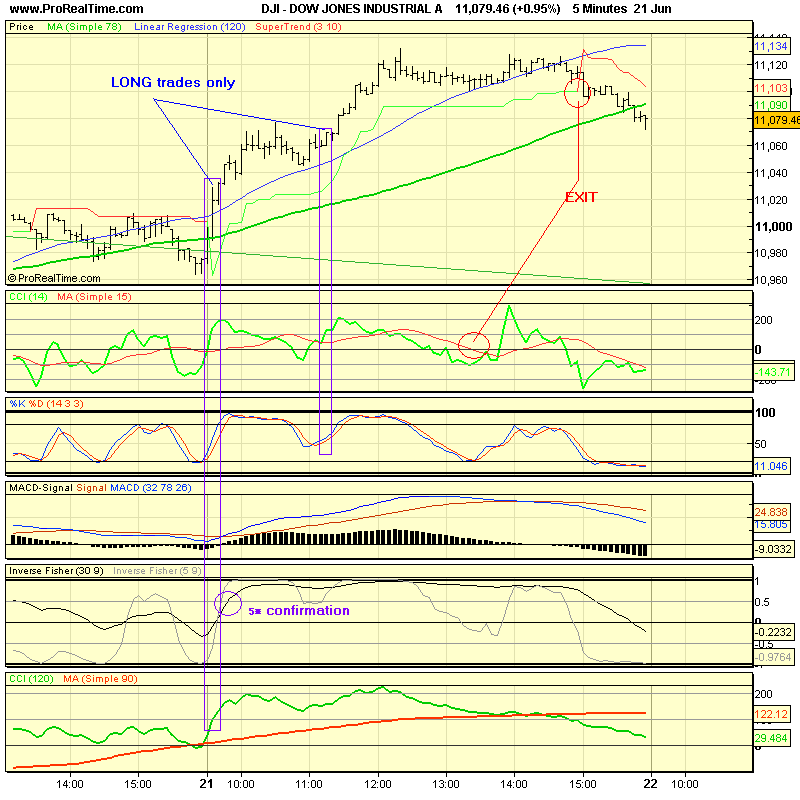
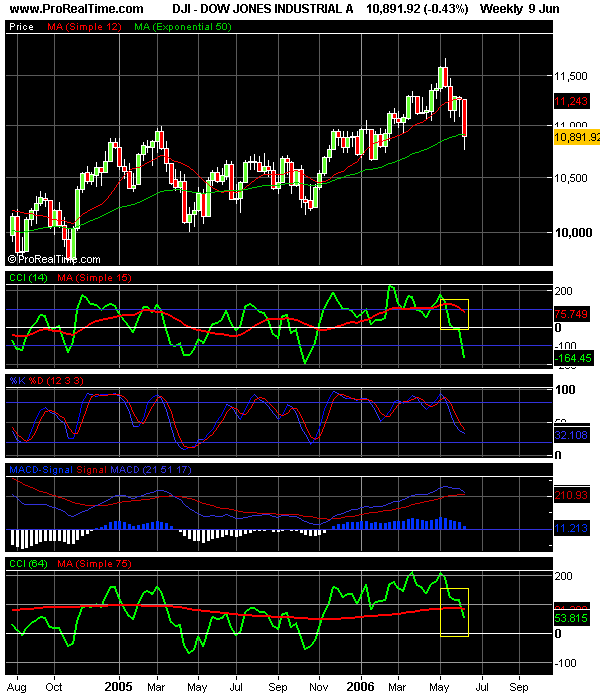
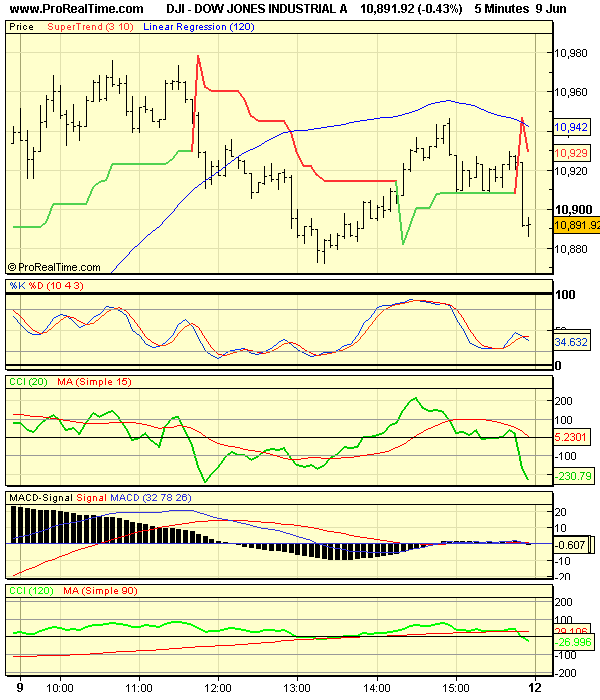
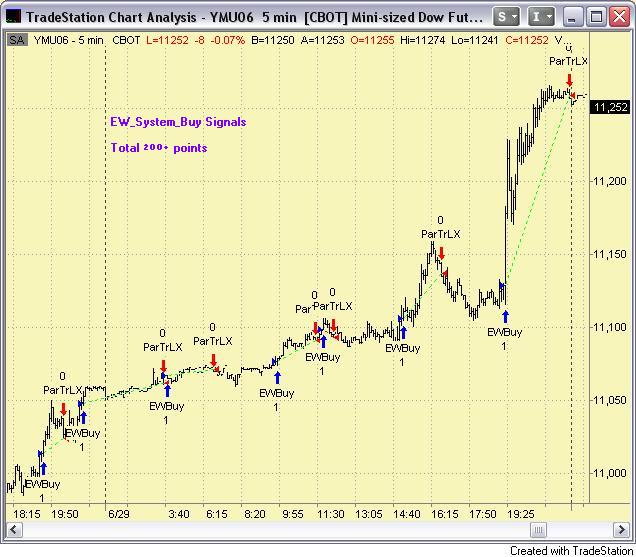
The chart above is Long entries since 28th evening break out time.

Back testing results

The EW system is generating live signals. They are not automated as yet.

Results from back testing over the last three weeks are quite satisfactory. Here are the results from 8 June to 29 June:

Long Trades

  • Total 16 trades;
  • Winning Trades 11, Losing trades 5, BreakEven trades 0;
  • Max win points in a trade : 128. Max loss trade (-22);
  • Consecutive winning trades 5, consecutive losing trades 2;
  • Average win/trade 52 pts, average loss/trade 21;
  • Total win points 572, total loss points -104;
  • Net winning points = 468.

Short Trades

  • Total 45 trades;
  • Winning Trades 19, Losing trades 16, BreakEven trades 10;
  • ( BreakEven trades is triggered when the profits floor of 20 points was reached and then come back to EntryPrice )
  • Max win points in a trade 123, max loss trade - 38;
  • Consecutive winning trades 7, max losing trades 3;
  • Average win/trade 33, average loss/trade 13;
  • Total win points 629, Total loss points 211;
  • Net Winning points 418;

TOTAL NET GAINS = 886.

Thursday, June 22, 2006

The market is always right

It was a weak BUY day.

Leo was buying with "expectations" without a valid signal from my system.

Our system suggested a decline to 11026, and the BUY number is 10989.

If momentum was strong enough, the system would give a signal at higher prices .

Momentum was weak & should have waited until the bearish pressure is exhausted.

Long 11030 (still open).

The system gave a Short signal at 11040, that was the only valid signal for today.

If it doesn't rally in the early session tomorrow, it has to be closed. 11040 resistance is the key again.

Repeat " expectations are not trading signals".

Just to recap the system trading:

  • No guessing tops and bottoms
  • No predicting the targets
  • No signal, no trade
  • Failed signal, immediate exit
  • Protect the capital in a working trade
  • Take what the system delivers, be it the profits or the loss
  • Catching a trend is easy, riding the trend is difficult as it takes calm mind not to take easy profits

The system will deliver consistent profits, there is no limit to the amount of returns. However, risk must be defined and limited.

Wednesday, June 21, 2006

No shortsale please


Today was Shortsale day. Yesterday was SELL day and the closing was weak, thus it was NOT EXPECTED to see it testing yesterday's highs of 11030.

But DOW defied expectations, as the markets will always do, being independent from analysts.

It reached 11030 in the first 10 minutes, setting a very bullish tone.

Our system signalled Long entry, later confirming the move as a 5 Star trending move. All we had to do was place a break-even oreder and follow the trend, placing trailing stops at Super Trend support line.

Another Long entry above 11060 pushing the prices to 11130+.

This kind of shortsale day rally is a very bullish behaviour. We can 'expect' the market to go even higher in the coming days.

But, 'expectations' are not trading signals. We must follow the system.

Let's give ourselves a little bit of stress free trading environment.

Tomorrow = BUY day

CCI is set for a bull run as long as slow MACCI line is above 100 line.

Any dip should be bought into.

Daily chart

This 11,130 is 50-day EMA. Will it break out? But 50-day SMA is at 11,208, so some more room for the upside.

Daily chart reading says it can go higher but bearish pressure is still following it as it looks like it will meet resistance at high prices.

Friday, June 16, 2006

Dow NR7 day

Today was narrow range day (61pts, not so bad but quite low comparatively).

Caught up in a couple of false break outs, momentum break outs did not work well on this kind of day.

The shortsale part of the day came very late.

Monday is BUY day in TTT but.......

Because of today's weak closing, we can expect a low made first on Monday (around 10985, today's low).

The daily chart points to a technical resistance at 11040, the downside is at least 100 pts.

Besides, NR7 day may be followed by a trending day.

If the decline does not go below 10985, look to go Long on momentum strength, otherwise to go short.

So.. decided to keep the short trade open for Monday. Stop order at 11044. This is very important number in daily chart.

We are "Strictly System Trading" but this daily chart is for guidance.

There are two reasons for a steep decline:-

  1. Touching the upper channel line of downward trend
  2. Head and shouder neck line re-test and decline

For further upward rally:-

  1. Large volume picking up on the bounce

Let's see...


Thursday, June 15, 2006

Dow reached higher prices

Just as expected, DOW is making follow through to higher prices. Yesterday's up trend is locked with super trend +120 points.

There was a bit of shake out and then it moved on.

The up trend continued all the way to 11030+. A very nice up trend, from 10750+ to 11030, 280 points!

5 Star System entry delivers the results.

Tomorrow is Shortsale day.

But in the uptrend, the second part of the day is often bullish, it would mean a very bullish situation which would last for at least another week.

Two day rally was abit parabolic. We might get a nice shortsale tomorrow.

Wednesday, June 14, 2006

Buy day for DOW


Today was BUY day but the buying power came quite late. There was a number of buy attempts in the earl but they were heavily sold off.

We took a short trade when it breached super trend support. But later it was stopped out as the decline did not materialise into a proper down trend.

Last hour buying was much more convincing and a long trade was taken @10750+, exited the trade @10790+. A bit too early, but still not convinced about after hour trading.

It was frustrating to get caught up in the whipsaws but BUY days in the beginning of a trend are usually late buying days.

News impact

CPI came higher than expected- core rate 0.3%, expected 0.2%. But the market did not fall to pre-market levels of 10660s.

Tomorrow is SELL day but today's closing was 99%. A follow through to higher prices is expected for tomorrow.

Tuesday, June 13, 2006

Bulls vs Bears power struggle


Today was shortsale day.

In the system view, today was really a struggle between bulls and bears. Yesterday's down trend was interrupted when the prices broke out above super trend at 10820.

Out of market prices went down as low as 10750, perhaps an indication of the market's bias.

Nevertheless, there was a short entry @10800 which deliverd about 40 points

We missed second short entry @10780. The main reason for passing that trade was simply because long-term CCI staying above long-termCCIMA. It did not cross down convincingly, a sign of technical resistance.

What happened next was not magic. Prices bounced hard & rallied 100 points. We took the long trade, out before it hit 10800. It wasn't meant to be a trend trade.

The last 100 points decline was a surprise.

Tomorrow = BUY day

Monday, June 12, 2006

5 Star System Shortsale DOW Index


Dow traded lower prices as indicated by the Friday's closing. A weak closing on BUY day is usually followed by Buy Day Low Violation on SELL DAY (per Taylor's Book Method)

Today was SELL DAY. No surprise. Dow ended 99 points lower.

Technically, there were two scalp shorts in the early session. Our system shouted SELL in the second session after lunch time.

Early Warning System identified a Short entry and it was confirmed by 5 Star System.

A nice decline went for 100+ points.

Our system demands courage to follow it, especially when the trade is in substantial profits.

Take emotion out of trading. To be successful in trading, the attitude towards money has to be adjusted.

We take as much profits as the system delivers.

Friday, June 09, 2006

Serious technical damage in Blue Chip Index Dow

In weekly Dow chart, it is resting right on 50 week moving average line. CCI lines crossed down CCIMA lines.

The fast CCI line hesitated on Zero line for two weeks but this week was the penetration to the negative side. It is now -164.45 as seen in the chart.

The slow CCI line also crossed into MA line. It crossed up in November last year which resulted in 6 months bull run.

Now it just crossed down. Unless it is not rejected in two weeks' time, Dow will head into the bear trend which may last a few months.

Bull side

  • 50 wk MA line support
  • Stochastics near over-sold (a bit pre-emptive to say that)

Bear side

  • fast CCI line cross down Zero line
  • slow CCI line cross down for the first time in more than six months
  • MACD losing momentum

Unless it can come back above 11243, we favour more down side.

Trading DOW : Bearish BUY day

Bullish attempts failed when the prices broke down below Super Trend(ST) support line. Yesterday's LONG at 10855 gave us +80 points.

Today is range day in technical terms because long-term CCI could not penetrate above 100 line and this rejection made MACDHistogram Momentum's bearish move in charge.

Midday, prices reversed the trend. But broke down below ST again.

Tomorrow: SELL day

We can expect breach of today's low as the closing was weak on Buy day. Today was NR5 day as well. Some bearish pressure will force the index to trade lower. It may recover from lower prices though.

Thursday, June 08, 2006


What a nice day it turned out to be.

As expected in the previous post, there was a nice short entry and the decline was swift and ruthless. Actually, as shown in the chart, the Shortsale signal came in late yesterday's session. Anyway, we entered the trade soon after the opening for a nice down trip.

But just as cautioned in earlier post, it turned out to be a V-shaped Shortsale day. On a shortsale day, this kind of behaviour is telling us that the buyers are stepping in. Biggies are changing their portfolios whatever it may be. For a swing trader, it says tomorrow is important. heehe everyday is important. If there is just a small decline in the earlier session and the prices break out to the upside, then it is a Long entry. If not, .. yes, it is still in the down trend.

Tomorrow: BUY day

End of Day signal says there is a resistance. So look for an early decline, perhaps a small one, which can be another LONG entry.

Well, we don't guess tops and bottoms. Let the market decide. The Long entry at 10850 still holds. 30min CCI is around Zero line. If it penetrates north, a BUY day will be in action. Otherwise, CCI Zero Line Rejection will give us a nice short entry.

DOW: round trip day


BUY signal on the 6th June delivered 100+ points. But it did not last long. CCI rejection at +100 level gave a reverse signal, with a SHORT confirmation at 11000 area when CCI crossed under CCIMA (the red line).

This morning, the futures were traded below 10900 level, which was -100 points after the SHORT signal.

Today is Shortsale day. In the downtrend, the only thing to be cautious is V-shaped shortsale day. Otherwise, look for a SHORT entry with a view to cover tomorrow, Friday when the prices hit a new low.

Tuesday, June 06, 2006

Dow has fallen 700 points


Today marks the completion of downward Wolfe Waves. As shown in the above chart, Dow has fallen from the highs of 11670 to the lows of 10926. As we stated in the earlier post, Dow actually broke 11000 barrier.

Our system is reacting well to this week's sell-off. We have more confidence in the system than before. By the way, we will not sell our system. It is a discretionary system and can not be automated.

We wish everybody a successful trading career.